
Capacity planning: how to know when production is overloaded
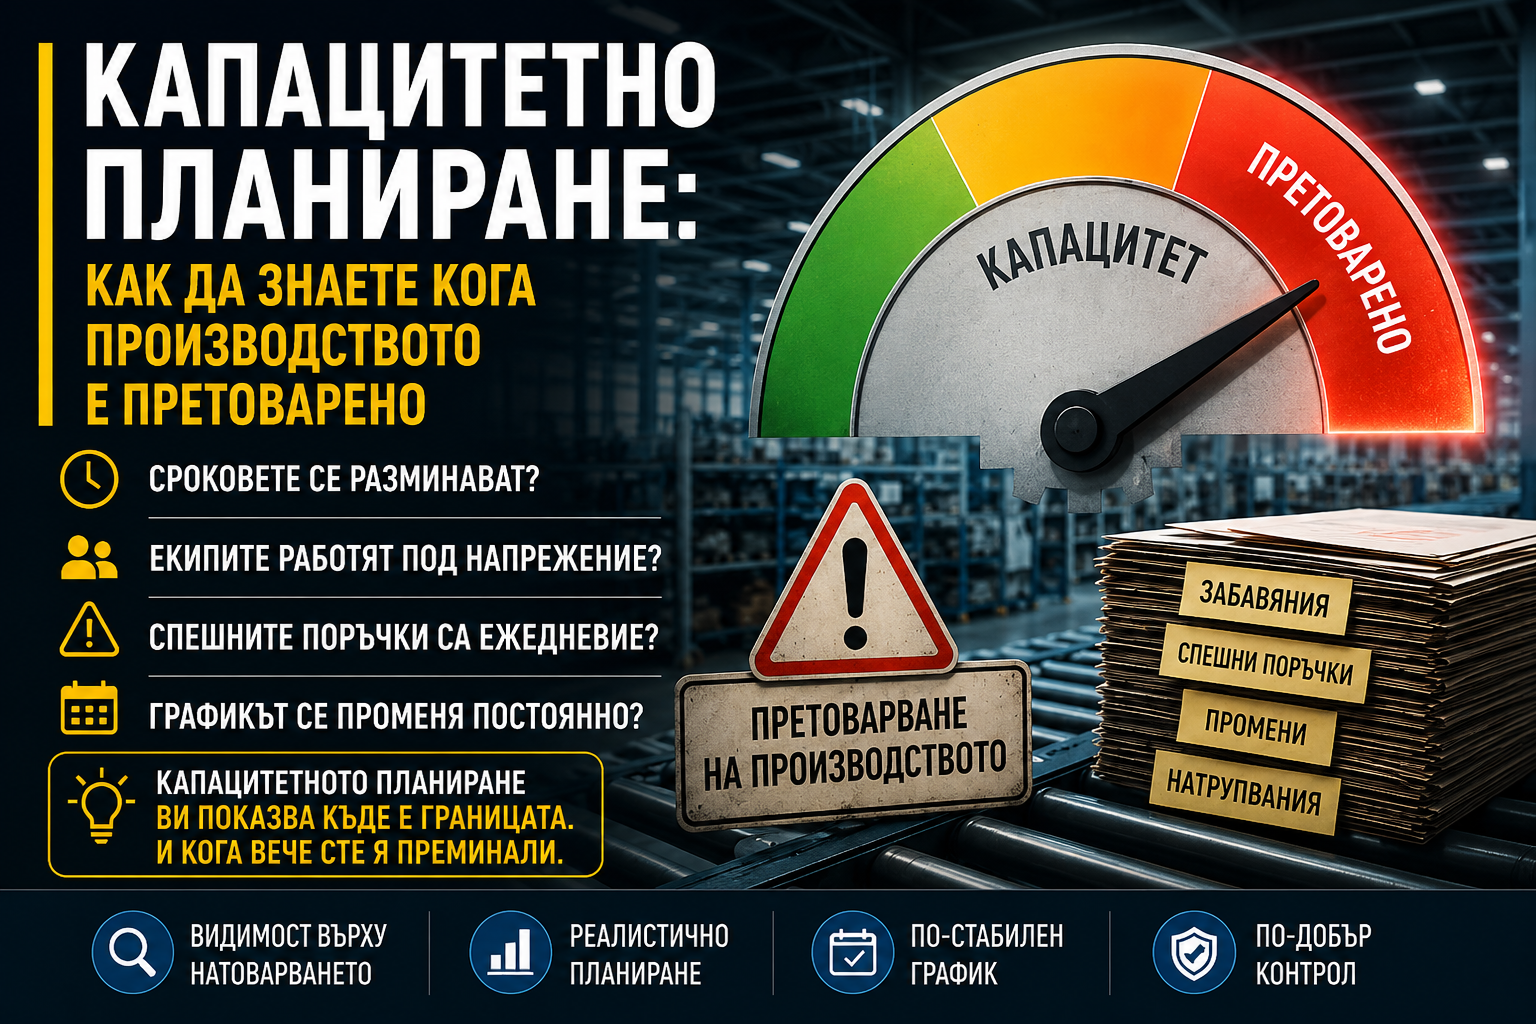
Overload rarely looks obvious
In many manufacturing operations, overload does not look obvious.
There is no clear moment where someone says: "We have hit the limit."
Instead it happens gradually:
- deadlines start drifting
- teams work under pressure
- rush orders become a daily routine
- the schedule changes constantly
And the cause is often not a shortage of people.
It is a lack of clarity about capacity.
Capacity planning is what shows you where the limit is.
And when you have already crossed it.
What is capacity planning?
Capacity planning is the process of matching:
- the resources you have (people, machines, time)
- against the load (orders, operations, tasks)
In other words:
How much work you have versus how much work you can actually take on.
The goal is not simply to plan.
The goal is to plan within real capacity.
What does "overloaded production" mean?
Production is overloaded when:
- the planned work exceeds real capacity
- tasks cannot be completed in the time allotted
- resources run flat out with no buffer
- every change causes chaos
Important:
Overload does not always mean 100% utilisation.
It often starts much earlier.
6 signals that production is overloaded
1. Deadlines drift regularly
If missed deadlines are not the exception but the pattern, you are probably planning above capacity.
2. Teams permanently work "on the edge"
There is no buffer.
Every unexpected task creates tension.
3. The schedule changes daily
Frequent resequencing is a signal that the plan does not match reality.
4. Rush orders become the norm
When everything is urgent, nothing is under control.
5. Work piles up between operations
That often means capacity is not balanced.
(and it often leads to bottlenecks)
6. Production depends on catching up
If you frequently rely on extra effort to make a deadline, the system is overloaded.
Why manufacturers end up overloaded
Overestimating capacity
Planning to the best case rather than to reality.
No visibility over the load
You cannot see how much work sits at each stage.
Planning at order level rather than operation level
The order looks realistic, but broken down into operations it is not.
Ignoring small delays
Small deviations accumulate and distort the whole plan.
No buffers
The plan is "perfect", but not resilient.
How to work out your real capacity
Break production down by operation
Looking at it at "order" level is not enough.
Capacity becomes visible at the level of:
- operation
- work centre
- team
Measure how long tasks take
Not by assumption.
From real data.
Include the real constraints
Capacity is not only time.
It includes:
- people
- machines
- setups
- interruptions
- downtime
Add a buffer
Running at 100% is not sustainable.
Real capacity is always lower than theoretical capacity.
Plan to the weakest point
Capacity is set by the bottleneck.
Not by the fastest operation.
Why Excel often misleads on capacity planning
Excel can show a plan.
But it rarely shows:
- the real load
- overloaded operations
- dynamic changes
- where the plan breaks
Which is why it often looks like everything "adds up".
Until execution starts.
How better visibility helps
When you have a clear picture of:
- load per operation
- capacity per resource
- progress per order
you can see the overload before it happens.
That allows:
- more realistic planning
- less resequencing
- a more stable schedule
- better control
In closing
Overload is not simply the result of having a lot of work.
It is the result of an imbalance between load and capacity.
The earlier you see that limit, the easier production is to manage.
And capacity planning is the tool that shows you where it is.
See how WispTrack plans production — an order queue, real capacity, skills, machines, and weekly schedules.
production planning software →Ready to simplify your production? Book a free demo call.
Book a demo